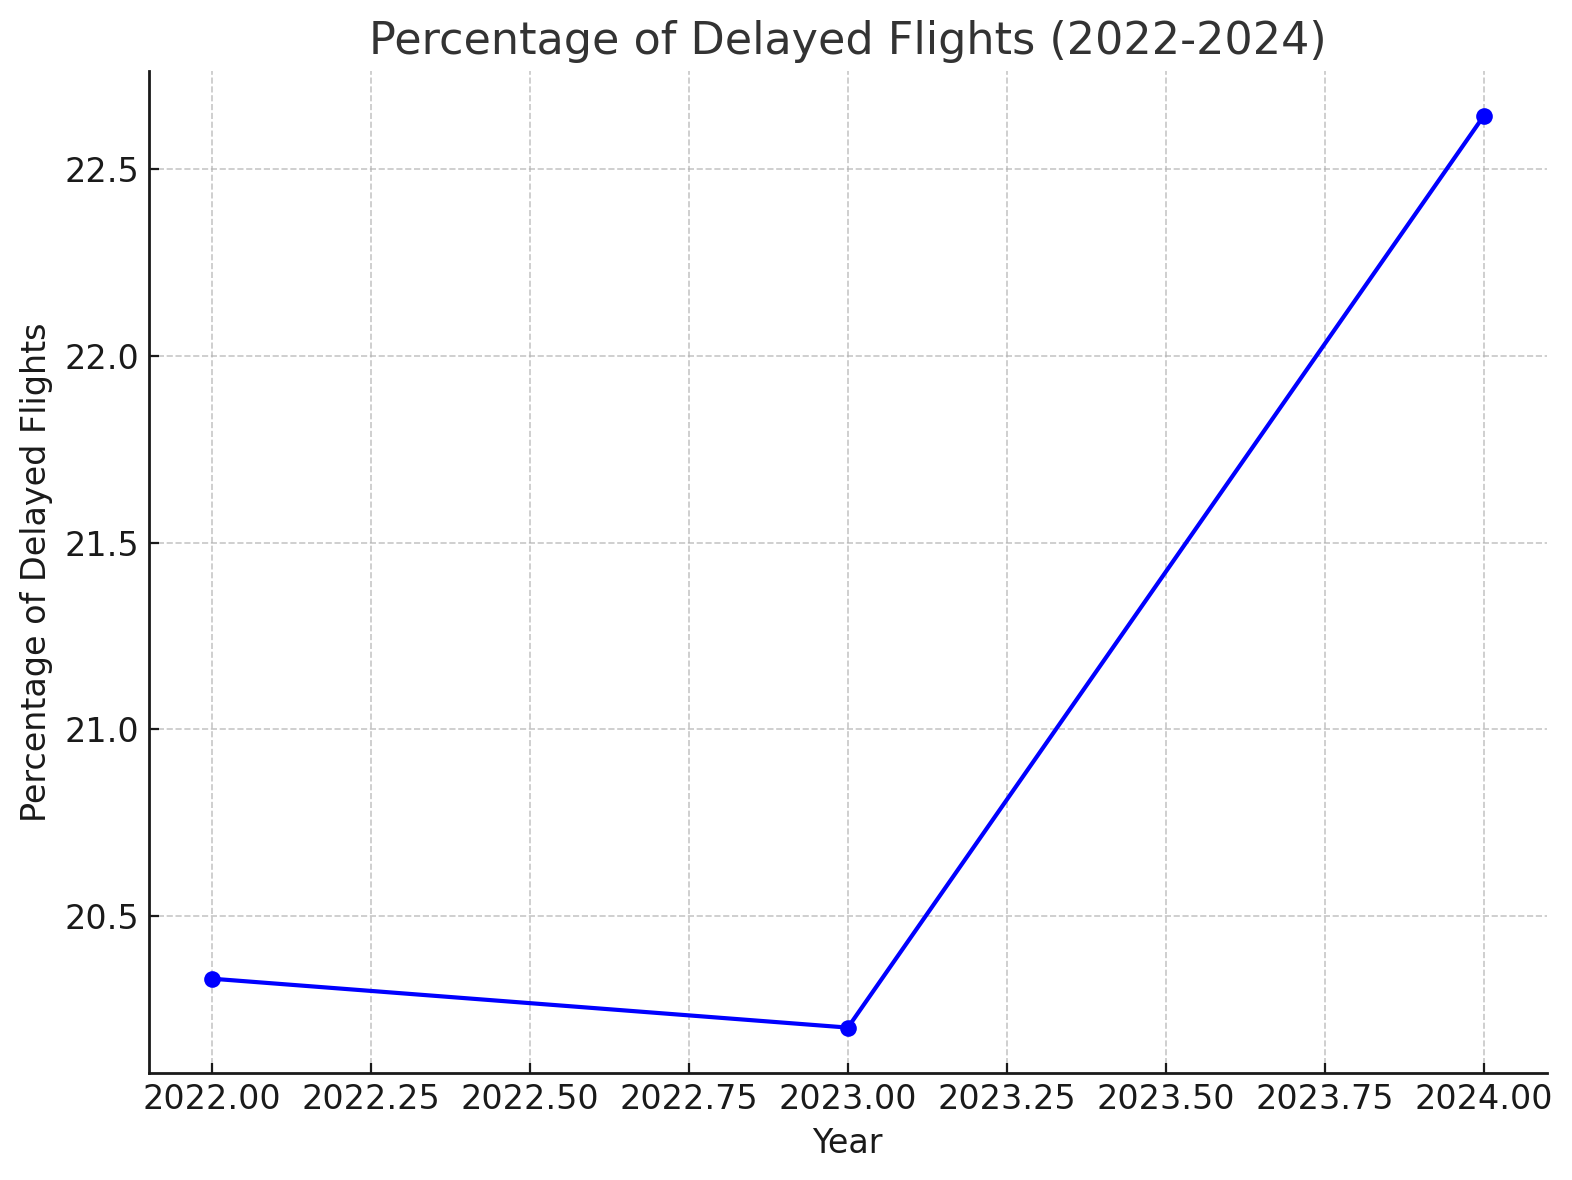
In 2024, the aviation industry witnessed a significant increase in flight delays, underscoring substantial operational challenges across global airports and airlines. This report presents an in-depth analysis of the causes behind these delays, evaluating airport and airline performance in managing such disruptions. A comparative study over the past three years (2022-2024) reveals an upward trend (based on the stats gathered from Bureau of Transportation Statistics), with a marked escalation in delays in 2024. This trend has profound implications for passengers, airlines, and the broader economy.
Introduction
Flight delays have long been an element of the travel experience; however, their frequency and duration have intensified recently. This report examines three critical dimensions contributing to this rise: primary causes, types of delays, and airport and airline performance in managing these disruptions.

Airport and Airline Performance
Airports and airlines play an essential role in managing and mitigating delays. In 2024, their effectiveness in addressing these disruptions exhibited significant variance, influenced by region, airport size, and airline capabilities.
Airports
Major international airports with advanced infrastructure were generally more adept at managing increased traffic volumes. However, even top-tier airports encountered operational strain due to an unprecedented surge in travel demand. Smaller regional airports, by contrast, faced greater challenges, as they often lacked the necessary resources to manage high traffic volumes efficiently.
Best and Worst Performing Airports
Leading airports included Oakland International Airport (OAK) and Dallas Love Field (DAL), which maintained average delay percentages below 19%. These results indicate efficient operations, likely facilitated by favorable factors such as reduced congestion or effective scheduling practices. Other high performers, including John Wayne Airport (SNA) and San Jose International Airport (SJC), achieved low delay rates by prioritizing timely operations, enhancing passenger satisfaction and airline efficiency. Contributing factors likely include optimized resource allocation, proactive air traffic control management, and effective responses to weather-related challenges.
Worst Performing Airports
Conversely, airports such as New York’s LaGuardia (LGA) and Chicago O’Hare (ORD) were among the poorest performers, hindered by high congestion, adverse weather conditions, and dense air traffic. Major international hubs also experienced compounded delays due to connectivity demands and extensive transfer processes.
Best-Performing Airlines
The best-performing airlines, including Endeavor Air Inc. and Alaska Airlines Network, demonstrated notable reliability with delay rates below 10%. Their commitment to efficient scheduling and proactive delay management has set a benchmark for enhancing passenger experience and strengthening their reputation in a competitive industry.
Worst Performing Airlines
In contrast, airlines facing operational or staffing challenges experienced substantial delays, often exacerbated by cascading effects from previous late flights. These delays led to average delay rates exceeding 20%, with some carriers accumulating over 20,000 delay minutes monthly. This extended disruption directly impacts passengers, causing missed connections and scheduling conflicts, underscoring the need for scheduling, staffing, and coordination improvements.
Airline Delays by Month
Monthly analysis of average delays provides insight into seasonal trends in flight punctuality, with fluctuations influenced by weather and travel volume. Winter months, impacted by adverse conditions such as snowstorms and fog, generally experience longer delays. Similarly, summer months see elevated delay rates due to high travel demand and congested airspace. Recognizing these patterns is critical for airlines to refine operational strategies and enhance scheduling.
Weather-Related Delays
Unexpectedly, weather-related delays were higher in the summer months, driven by thunderstorms, increased air traffic, and operational strains resulting from peak travel volumes. High temperatures also impact flight operations, requiring longer takeoff distances and occasionally leading to schedule disruptions.
Best and Worst Airports for Non-Weather-Related Delays
Minneapolis-St. Paul International Airport (MSP), San Diego International Airport (SAN), and San Francisco International Airport (SFO) exemplify operational efficiency in managing non-weather-related delays, benefiting passenger experience and airline performance.
Meanwhile, Los Angeles International Airport (LAX), Philadelphia International Airport (PHL), and Newark Liberty International Airport (EWR) experienced significant operational inefficiencies, which adversely impacted their reliability and service quality.
Best and Worst Performing Airlines for Non-Weather-Related Delays
Airlines like Endeavor Air Inc. and Alaska Airlines Network exhibit strong performance in weather-related and non-weather-related delay metrics, showcasing high operational efficiency.
In contrast, carriers such as American Airlines Network, Spirit Airlines, and JetBlue Airways reveal a need for improvement in managing non-weather-related delays, underscoring the necessity of targeted strategies to address operational inefficiencies.
In conclusion, this analysis emphasizes the importance of targeted improvements in operational processes for airports and airlines. Addressing non-weather-related delays can significantly enhance performance, reduce disruptions, and improve customer satisfaction across the aviation sector.


